Microsoft has put a lot of effort in Hyper-V security. Hyper-V, and the whole virtualization stack, runs at the core of many of our products: cloud computing, Windows Defender Application Guard, and technology built on top of Virtualization Based Security (VBS). Because Hyper-V is critical to so much of what we do, we want to encourage researchers to study it and tell us about the vulnerabilities they find: we even offer a $250K bounty for those who do. In this blog series, we’ll explore what’s needed to start looking under the hood and hunt for Hyper-V vulnerabilities.
One possible approach to find bugs and vulnerabilities in the virtualization platforms is static analysis. We recently released public symbols for the storage components, which with the previous symbols that were already available, means that most symbols of the virtualization stack are now publicly available. This makes static analysis much easier.
In addition to static analysis, when auditing code, another useful tool is live debugging. It helps us to inspect code paths and data as they are in actual runtime. It also makes our lives easier when trying to trigger interesting code paths, breaking on a piece of code, or when we need to inspect the memory layout or registers at a certain point. While this practice is widely used when researching the Windows kernel or userspace, debugging the hypervisor and virtualization stack is sparsely documented. In this blog post, we will change this.
Brief Intro to the Virtualization Stack
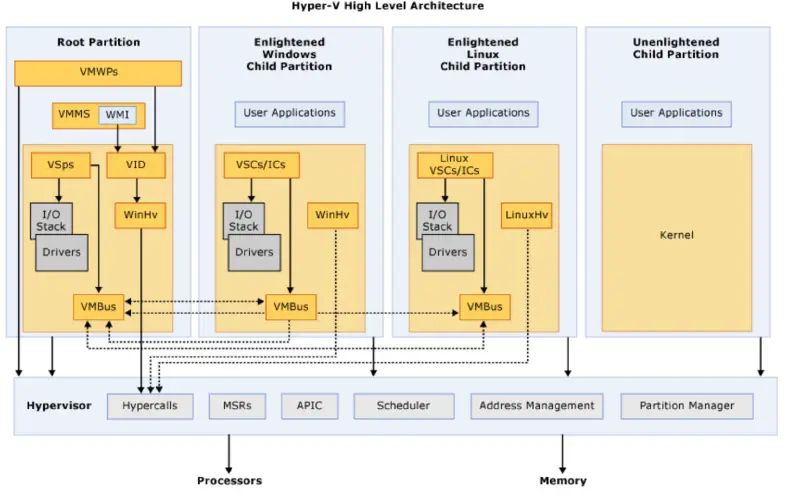
When we talk about “partitions”, we mean different VMs running on top of the hypervisor. We differentiate between three types of partitions: root partition (also known as a parent partition), enlightened guest partitions and unenlightened guest partitions. Unlike the other guest VMs, the “root partition” is our host OS. While it is a fully-fledged Windows VM, where we can run regular programs like a web browser, parts of the virtualization stack itself runs in the root partition kernel and userspace. We can think about the root partition as a special, privileged guest VM, that works together with the hypervisor.
For example, the Hyper-V Management Services runs in the root partition and can create new guest partitions. These will in turn communicate with the hypervisor kernel using hypercalls. There are higher level APIs for communication, with the most important one being VMBus. VMBus is a cross-partition IPC component that is heavily used by the virtualization stack.
Virtual Devices for the guest partitions can also take advantage of a feature named Enlightened I/O, for storage, networking, graphics, and input subsystems. Enlightened I/O is a specialized virtualization-aware implementation of communication protocols (SCSI, for example), which runs on top of VMBus. This bypasses the device emulation layer which gives better performance and features since the guest is already aware of the virtualization stack (hence “enlightened”). However, this requires special drivers for the guest VM that make use of this capability.
Hyper-V enlightened I/O and a hypervisor aware kernel are available when installing the Hyper-V integration services. Integration components, which include virtual server client (VSC) drivers, are available for Windows and for some of the more common Linux distributions.
When creating guest partitions in Hyper-V, we can choose a “Generation 1” or a “Generation 2” guest. We will not go into the differences between the two types of VMs here, but it is worth mentioning that a Generation 1 VM supports most guest operating systems, while a Generation 2 VM supports a more limited set of operating systems (mostly 64-bit). In this post, we will use only Generation 1 VMs. Detailed explanation about the differences is available here.
To recap, a usual virtualization setup will look like this:
| Root partition | Windows |
| Enlightened child partitions | Windows or Linux |
| Unenlightened child partitions | Other OSs like FreeBSD, or legacy Linux |
That’s everything you need to know for this blog post. For or more information, see this presentation or TLFS.
Debugging Environment
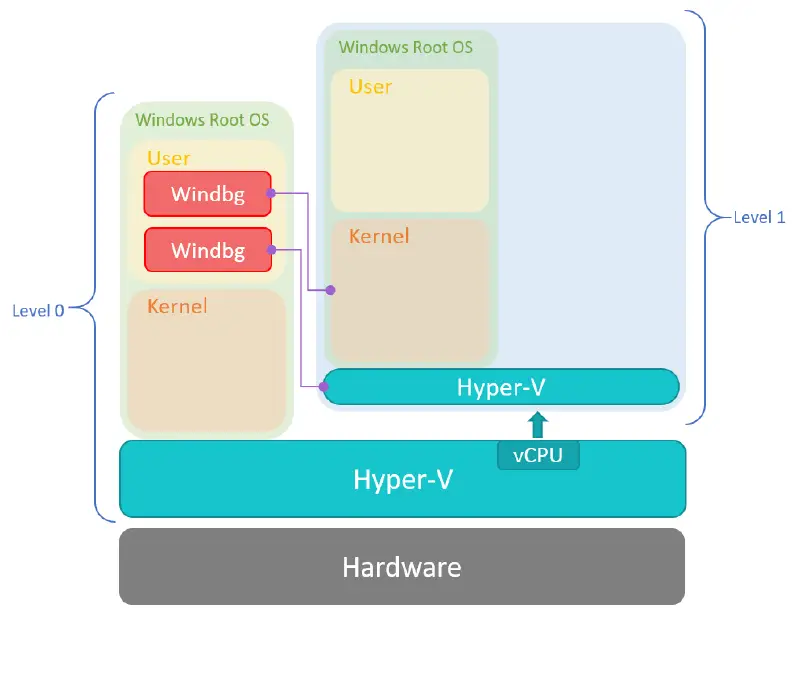
The setup we’re going to talk about is a debugging environment for both the hypervisor and the root partition kernel of a nested Windows 10 Hyper-V guest. We can’t debug the kernel and the hypervisor of our own host, for obvious reasons. For that, we’ll need to create a guest, enable Hyper-V inside it, and configure everything so it will be ready for debugging connection. Fortunately, Hyper-V supports nested virtualization, which we are going to use here. The debugging environment will look like this:
Since we want to debug a hypervisor, but not the one running the VM that we debug, we will use nested virtualization. We will run the hypervisor we want to debug as a guest of another hypervisor.
To clarify, let’s introduce some basic nested virtualization terminology:
L0 = Code that runs on a physical host. Runs a hypervisor.
L1 = L0’s hypervisor guest. Runs the hypervisor we want to debug.
L2 = L1’s hypervisor guest.
In short, we will debug an L1 hypervisor and root partition’s kernel from the L0 root partition’s userspace.
More about working with nested virtualization over Hyper-V can be found here.
There’s debug support built into the hypervisor, which lets us connect to Hyper-V with a debugger. To enable it we’ll need to configure a few settings in BCD (Boot Configuration Data) variables.
Let’s start with setting up the VM we’re going to debug:
-
If Hyper-V is not running already on your host:
- Enable Hyper-V, as documented here.
- Reboot the host.
-
Set up a new guest VM for debugging:
-
Create a Generation 1 Windows 10 guest, as documented here. While this process would also work for Generation 2 guests, you will have to disable Secure Boot for this to work.
-
Enable VT-x in the guest’s processor. Without this, the Hyper-V Platform will fail to run inside the guest. Note that we can do it only when the guest is powered off. We can do that from an elevated PowerShell prompt on the host:
Set-VMProcessor -VMName -ExposeVirtualizationExtensions $true -
Since we’ll debug the hypervisor inside the guest, we need to enable Hyper-V inside the guest too (documented here). Reboot the guest VM afterwards.
-
Now we need to set the BCD variables to enable debugging. Inside the L1 host (which is the inner OS we just set up), run the following from an elevated cmd.exe:
bcdedit /hypervisorsettings serial DEBUGPORT:1 BAUDRATE:115200
bcdedit /set hypervisordebug on
bcdedit /set hypervisorlaunchtype auto
bcdedit /dbgsettings serial DEBUGPORT:2 BAUDRATE:115200
bcdedit /debug on
This will:
- Enable Hyper-V debugging through serial port
- Enable Hyper-V to launch on boot, and load the kernel
- Enable kernel debug through a different serial port
These changes will take affect after the next boot.
-
-
To communicate with these serial ports, we need to expose them to the L0 host, which is the OS we will work from. We can’t set hardware configuration when the guest is up, so:
- Shut down the guest.
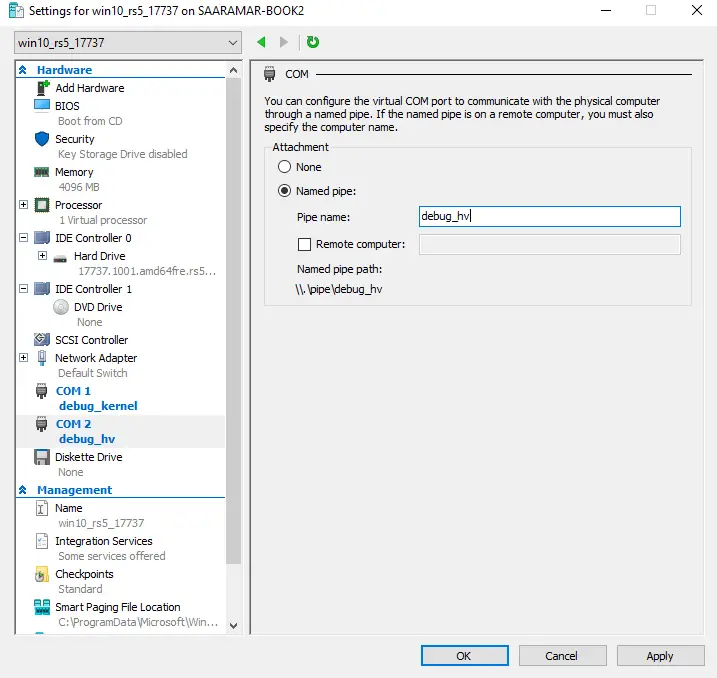
- From Hyper-V manager, right click on the VM, click “Settings”, then in the left pane, under “Hardware”, select COM1. From the options pick a Named Pipe and set it to “debug_hv”.
- Do the same for COM2 and set its name to “debug_kernel”.
-
Another way of doing that is with the
-
cmdlet.
-
This will create two named pipes on the host, “.pipedebug_hv” and “.pipedebug_kernel”, used as a serial debug link for the hypervisor and the root partition kernel respectively. This is just an example, as you can name the pipes however you’d like.
-
Launch two elevated WinDbg instances, and set their input to be the two named pipes. To do this, click: Start Debugging -> Attach to kernel (ctrl+k).
-
Boot the guest. Now we can debug both the root partition kernel and the hypervisor!
There you have it. Two WinDbg instances running, for both the kernel and Hyper-V (hvix64.exe, the hypervisor itself). There are other ways to debug Hyper-V, but this is the one I’ve been using for over a year now. However, other people may prefer different setups, for example @gerhart_x’s blogpost about setting up a similar environment with VMware and IDA.
Another option that is similar to this setup is debug over network instead of serial ports using a component called kdnet. This is somewhat similar to this environment and is documented here.
Static Analysis
Before we’ll get our hands dirty with debugging, it could be useful to have a basic idb for the hypervisor, hvix64.exe. Here are a few tips to help set it up.
- Download vmx.h and hvgdk.h (from WDK), and load them. These headers include some important structures, enums, constants, etc. To load the header files, go to File -> LoadFile -> Parse C header file (ctrl+F9). With this, we can then define immediate values as their vmx names, so functions handling VT-x logic will be much prettier when you reach them. For example:
- Define the hypercalls table, hypercall structure and hypercall group enum. There is a public repo that is a bit outdated, but it’ll certainly help you start. Also, the TLFS contains detailed documentation over most of the hypercalls.
- Find the important entry point functions that are accessible from partitions. The basic ones being the read/write MSR handlers, vmexit handler, etc. I highly recommend defining all the read/write VMCS functions, as these are used frequently in the binary.
- Other standard library functions like memcmp, memcpy, strstr can easily be revealed by diffing hvix64.exe against ntoskrnl.exe. This is a common trick used by many Hyper-V researchers (for example, here and here).
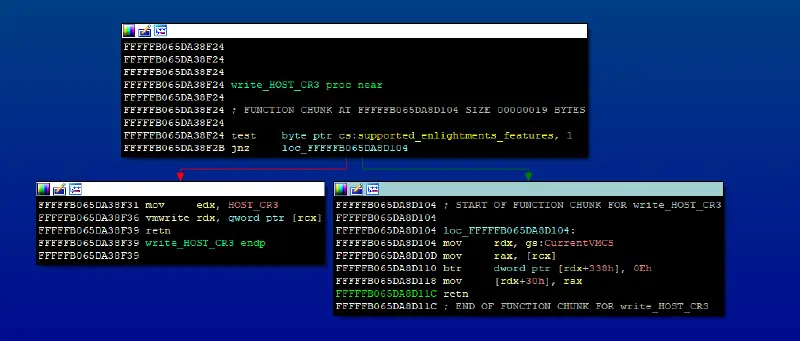
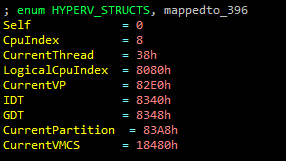
- You will probably notice accesses to different structures pointed by the primary gs structure. Those structures signify the current state (e.g. the current running partition, the current virtual processor, etc.). For instance, most hypercalls check if the caller has permissions to perform the hypercall, by testing permissions flags in the gs:CurrentPartition structure. Another example can be seen in the previous screenshot: we can see the use of CurrentVMCS structure (taken from gs as well), when the processor doesn’t support the relevant enlightenment features. There are offsets for other important structures, such as CurrentPartition, CpuIndex and CurrentVP (Virtual Processor). Those offsets change between different builds, but it’s very easy to find them.
For unknown hypercalls, it’s probably easier to find the callers in ntos and start from there. In ntos there is a wrapper function for each hypercall, which sets up the environment and calls a generic hypercall wrapper (nt!HvcallCodeVa), which simply issues a vmcall instruction.
Attack surface
Now that we have the foundations for research, we can consider the relevant attack surface for a guest-to-host escape. There are many interfaces to access the hypervisor from the root partition:
- Hypercalls handlers
- Faults (triple fault, EPT page faults, etc.)
- Instruction Emulation
- Intercepts
- Register Access (control registers, MSRs)
Let’s see how we can set breakpoints on some of these interfaces.
Hyper-V hypercalls
Hyper-V’s hypercalls are organized in a table in the CONST section, using the hypercall structure (see this). Let’s hit a breakpoint in one of the hypercalls handlers. For that we need to execute a vmcall in the root partition. Note that even though VT-x let us execute vmcall from CPL3, Hyper-V forbids it and only lets us execute vmcall from CPL0. The classical option to call a hypercall would be to compile a driver and call the hypercall ourselves. An easier (though a bit hacky) option is to break on nt!HvcallInitiateHypercall, which wraps the hypercall:
Where rcx is hypercall id, and rdx, r8 are the input and output parameters. The register mapping is different for fast and non-fast calling convention, as documented in the TLFS:
Register mapping for hypercall inputs when the Fast flag is zero:
Register mapping for hypercall inputs when the Fast flag is one:
Let’s see an example for that. We will break on a hypercall handler, after triggering it manually from the root partition. To keep things simple, we’ll pick a hypercall which usually doesn’t get called in normal operation: hv!HvInstallIntercept. First, we need to find it’s hypercall id. There’s a convenient reference for documented hypercalls in Appendix A of TLFS. Specifically, hv!HvInstallIntercept is hypercall id == 0x4d.
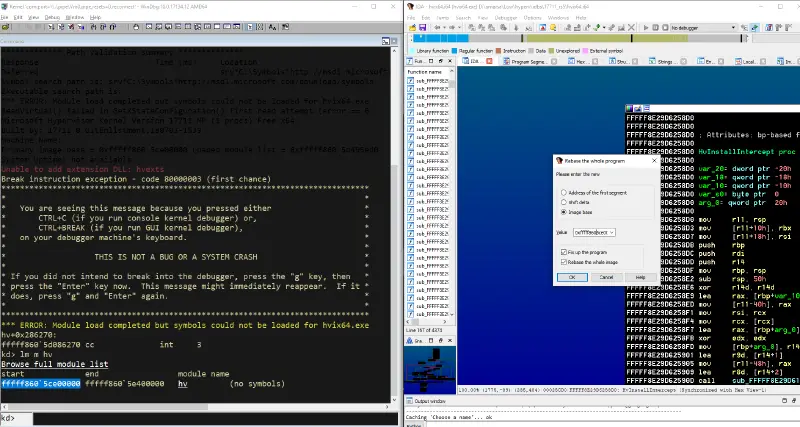
Assuming we already have the two debuggers running and an IDA instance we use as a reference, we should first rebase our binary (Edit -> Segments -> Rebase Program) to the base of the running hypervisor address. This step is optional but would save us the need to calculate VAs manually due to ASLR. To get the Hyper-V base, run “lm m hv” in the debugger that’s connected to the hypervisor, and use that address to rebase the idb:
Great! Now, on the second debugger, which is connected to the kernel, bp on nt!HvcallInitiateHypercall.
When this breakpoint hits (happens all the time), ntos is just about to issue a hypercall to Hyper-V. The “hypercall input value”, which hold some flags and the hypercall call code, is on rcx (first argument to nt!HvCallInitiateHypercall). By modifying rcx, we can change the hypercall that will get called.
The hypercall input value isn’t simply the id: it’s the id encoded with some flags, which indicate what type of hypercall we are issuing, and in what “fashion” we want this hypercall to be called. There are different ways to call a hypercall in Hyper-V:
- Simple – perform a single operation and has a fixed-size set of input and output parameters.
- Rep (repeat) – perform multiple operations, with a list of fixed-size input and/or output elements.
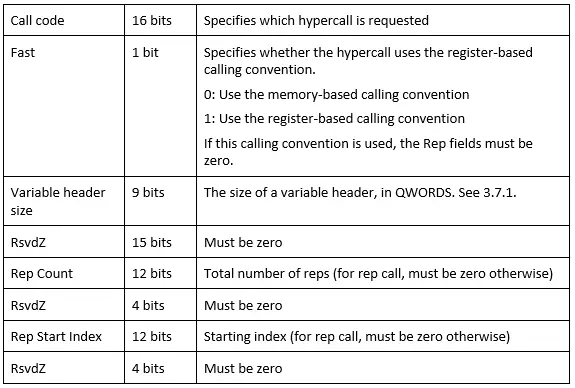
The encoding for the hypercall input value is available in the TLFS. The lower bits represent the call code for the hypercall:
And the meaning of the fields can be seen here (source: TLFS):
When we break on nt!HvcallInitiateHypercall, we might end up hitting a rep or fast hypercall. Some hypercalls must be called “fast” (as indicated by the 16th bit) or in a repeat. You can see these requirements in the same hypercall table in appendix A in TLFS. For our example, we call it in with register-base calling convention, so set rcx=1<<16 | 0x4d (or in other words, hypercall id 0x4d, with “fast” bit on).
Now, let’s talk about how we pass arguments to hypercalls handlers when we call them from the root partition. The arguments are set in the rdx and r8 registers. Please note, that there is a difference between fast call and non-fast call (in non-fast call, r8 is the output parameter). In the upcoming example, we’ll see a fast call, so r8 will be the second argument.
Inside the hypercall handler, which resides in the hypervisor, the registers are managed differently. The first argument to the hypercall handler, rcx, is a pointer to a structure which holds all the hypercall’s arguments (so, rdx and r8 will be the first 2 qwords in it). The rest of the arguments, rdx, r8, will be set by the hypervisor, and we don’t have direct control over them from a guest partition.
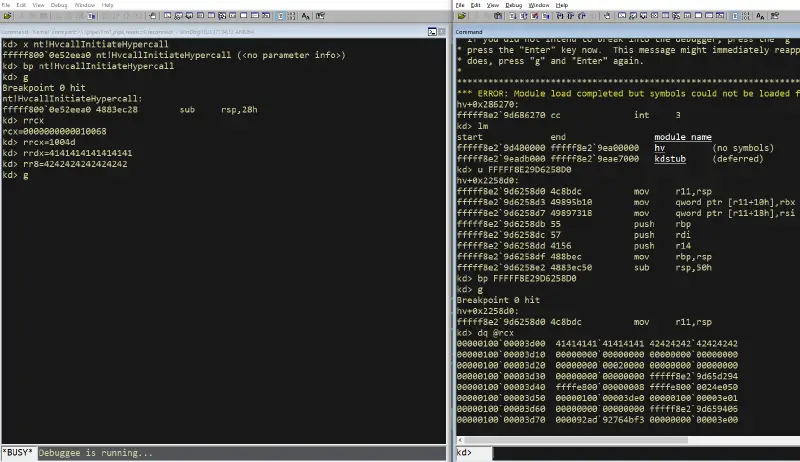
Let’s check it out on hv!HvInstallIntercept. On the left we see our kernel debugger where we break on nt!HvcallInitiateHypercall and set the registers. Then we continue execution and see that the hypercall handler is hit in hvix64.exe. There, *rcx will hold the arguments we passed on registers.
Success!
If we keep stepping, we will return from the function relatively fast, since the first thing that this hypercall handler does is getting the relevant partition by PartitionID, which is its first argument. Simply set rdx=ffffffffffffffff, which is HV_PARTITION_ID_SELF (defined among other definitions in the TLFS):
Then the flow can continue. It’s a pretty common pattern we find in lots of different hypercall handlers, so it’s worth to keep it in mind.
MSRs
Hyper-V handles MSR access (both read and write) in its VMEXIT loop handler. It’s easy to see it in IDA: it’s a large switch case over all the MSRs supported values, with the default case of falling back to rdmsr/wrmsr, if that MSR doesn’t have special treatment by the hypervisor. Note that there are authentication checks in the MSR read/write handlers, checking the current partition permissions. From there we can find the different MSRs Hyper-V supports, and the functions to handle read and write.
In this example, we will read MSR 0x40000200, which returns the hypervisor lowstub address, as documented by some researchers (e.g., here and here). We can read the MSR value directly from the kernel debugger, using the rdmsr command:
And we can see the relevant code in the MSR read handler function (in the hypervisor), which handles this specific MSR:
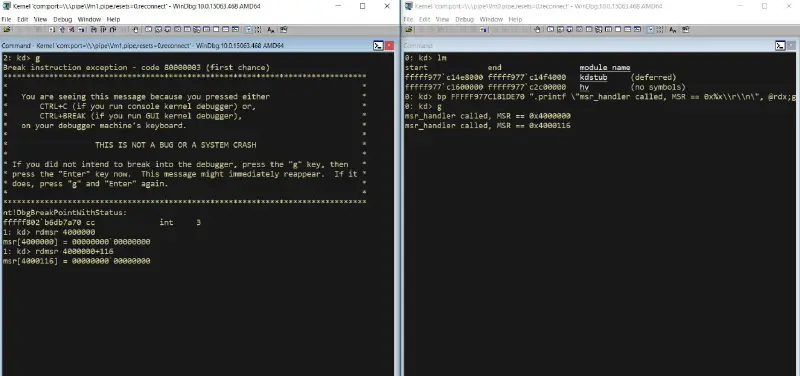
Instead of just breaking on MSR access, let’s trace all the MSR accesses in the hypervisor debugger:
bp ".printf "msr_handler called, MSR == 0x%xrn", @rdx;g"
This will set a breakpoint over the MSR read function. The function address changes between builds. One way to find it is to look for constants in the binary that are unique to MSRs, and go up the caller functions until you reach the MSR read function. A different way is to follow the flow top-down, from the vmexit loop handler: in the switch case for the VMExit reason (VM_EXIT_REASON in the VMCS structure), you will find EXIT_REASON_MSR_READ which eventually gets to this function.
With this breakpoint set, we can run rdmsr from the kernel debugger and see this breakpoint hit, with the MSR value we read:
You can also set up a little more complicated breakpoint to find the return value of rdmsr, and trace MSR writes in a similar way.
Attack surface outside the hypervisor
To keep the hypervisor minimal, many components in the virtualization stack are running in the root partition. This reduces the attack surface and complexity of the hypervisor. Things like memory management and process management are handled in the root partition’s kernel, without elevated permissions (e.g., SLAT management rights). Moreover, additional components that provide services to the guests, like networking or devices, are implemented in the root partition. A code execution vulnerability in any of these privileged components should allow an unprivileged guest to execute code on the root partition’s kernel or userspace (depending on component). For the virtualization stack, this is equivalent to a guest-to-host, as the root partition is trusted by the hypervisor, and manages all the other guests. In other words, a guest-to-host vulnerability can be exploited without compromising the hypervisor.
(Source and more terminology can be found here).
As @JosephBialek and @n_joly stated in their talk at Blackhat 2018, the most interesting attack surface when trying to break Hyper-V security, is actually not in the hypervisor itself, but in the components that are in the root partition kernel and userspace. As a matter of fact, @smealum presented in the same conference a full guest-to-host exploit, targeting vmswitch, which runs in the root partition’s kernel.
Kernel components
As we can see in the high-level architecture figure, the virtual switch, partitions IPC mechanisms, storage and virtual PCI are implemented in the root partition’s kernelspace. The way those components and architecture is designed, is in the format of “consumers” and “provider”. The “consumers” are drivers on the guest side, and they are consuming some services and facilities from the providers, which reside in the root’s kernel. It’s easy to see them, since the providers usually have an extension of VSP (Virtualization Service Provider), while the consumers have an extension of VSC (Virtualization Service Client). So, therefore, we have:
| ROOT PARTITION KERNEL | GUEST PARTITION KERNEL | |
|---|---|---|
| Storage | storvsp.sys | storvsc.sys |
| Networking | vmswitch.sys | netvsc.sys |
| Synth 3D Video | synth3dVsp.sys | synth3dVsc.sys |
| PCI | vpcivsp.sys | vpci.sys |
And since those are simply drivers running in kernel mode, it’s very easy to debug them, simply with a standard kernel debugger.
It’s worth noting that some of the components have two drivers: one runs inside the guest’s kernel, and the other runs on the host (root partition). This design replaced the old virtualization stack design, which was in Windows 7. In Windows 7, the logic both for the root partition and for the child partitions were combined. After that, it got split, to separate the functionality of the root from the children to two different drivers. The “r” suffix stands for “root”. For example:
| Root Partition | Guest |
|---|---|
| vmbusr.sys | vmbus.sys |
| vmbkmclr.sys | vmbkmcl.sys |
| winhvr.sys | winhv.sys |
Quick tip:
The Linux guest-side OS component are integrated into the mainline kernel tree and are also available seperately. It is quite useful when building PoCs from a Linux guest (as done here, for instance).
User components
Many interesting components reside in the VM worker process, and it executes in the root partition’s userspace – so debugging it is just like debugging any other userspace process (however you might need to execute your debugger elevated on your root partition). There’s a separate Virtual Machine Worker Process (vmwp.exe) process for each guest, which is launched when the guest is powered on.
Here are a few examples of components that reside in the VMWP, which runs in the root partition’s userspace:
- vSMB Server
- Plan9FS
- IC (Integration components)
- Virtual Devices (Emulators, non-emulated devices)
Also, keep in mind, that the instruction emulator and the devices are highly complex components, so it’s a pretty interesting attack surface.
It’s just the start
In this post we covered what we feel is needed to start looking into Hyper-V. It isn’t much, but it is pretty much everything I knew and the environment I used to find my first Hyper-V bug, so it should be good enough to get you going. Having a hypervisor debugger made everything much clearer, as opposed to static analysis of the binary by itself. With this setup, I managed to trigger the bug directly from the kernel debugger, without the hurdles of building a driver.
But that’s only the tip of the iceberg. We are planning to release more information in upcoming blog posts. The next one will feature our friends from the virtualization security team, that will talk about VMBus internals, vPCI, and demo a few examples. If you can’t wait, here are some resources that are already available online and cover the internals of Hyper-V.
- Battle of SKM and IUM
- Ring 0 to Ring -1 Attacks
- Virtualization Based Security – Part 1: The boot process
- Virtualization Based Security – Part 2: kernel communications
- VBS Internals and Attack Surface
- HyperV and its Memory Manager
Here are some examples of previous issues in the virtualization stack:
- A Dive in to Hyper-V Architecture and Vulnerabilities
- Hardening Hyper-V through offensive security research
- Hyper-V vmswitch.sys VmsMpCommonPvtHandleMulticastOids Guest to Host Kernel-Pool Overflow
If you have any questions, feel free to comment on this post or DM me on Twitter @AmarSaar. I’d love to get feedback and ideas for other topics you would want us to cover in the next blog posts in this series.
Happy hunting!
Saar Amar, MSRC-IL

